
Metasurfaces · Model validation
Metalens modelling in etendue reproduces published focusing efficiencies, spot sizes and focal shifts
Two published metalenses recomputed from their nanostructure: amorphous-silicon posts at 1550 nm and silicon-nitride posts at 550 nm
Metalens modelling in etendue reproduces published
focusing efficiencies, spot sizes and focal shifts
Two published metalenses recomputed from their nanostructure: amorphous-silicon posts at 1550 nm
[1] and silicon-nitride posts at 550 nm [2]
| Purpose | How the results were recomputed |
| A metalens is a flat lens made of sub-wavelength pillars. | Each pillar is computed as a periodic array by rigorous |
| Its focusing efficiency, the size of its spot and its | coupled-wave analysis [3, 4], which gives its |
| behaviour across wavelength depend on the pillars, not | transmission and phase as a function of its diameter. The |
| only on the ideal phase profile. This note compares the | lens places, at each lattice site, the pillar whose |
| values computed by etendue with the values published | response is closest to the required hyperbolic phase. The |
| for two metalenses, simulated by full-wave methods and | transmitted field is then propagated to the image plane |
| measured. The systems are entered in etendue as their | by the angular spectrum method, and compared with an |
| authors describe them, without fitted parameters. | ideal lens of the same aperture. |
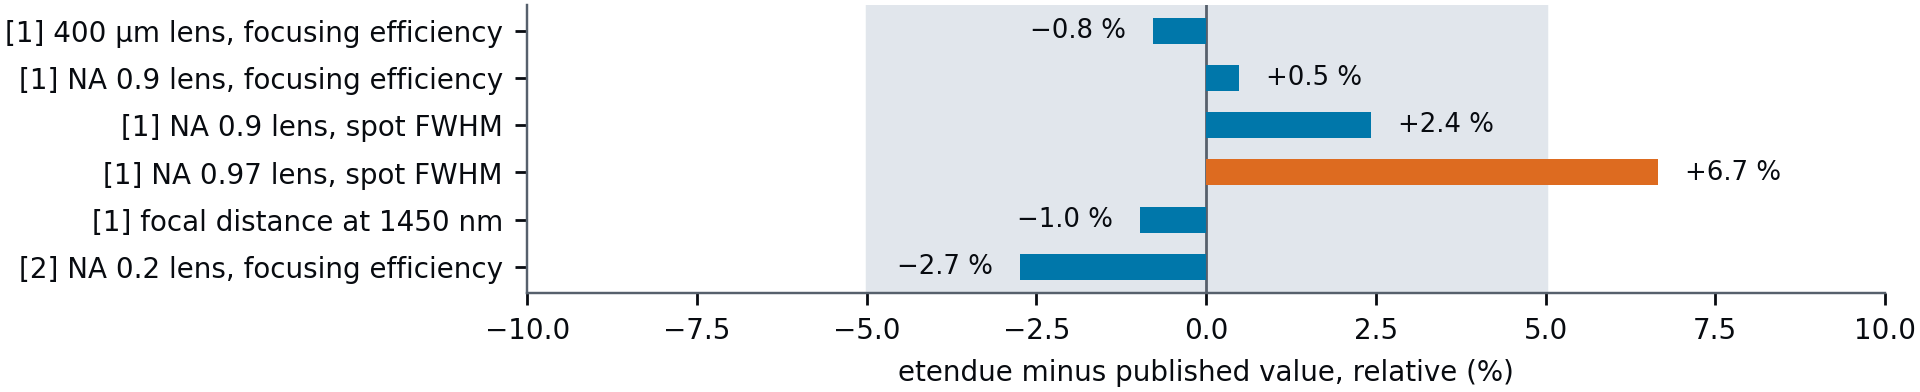
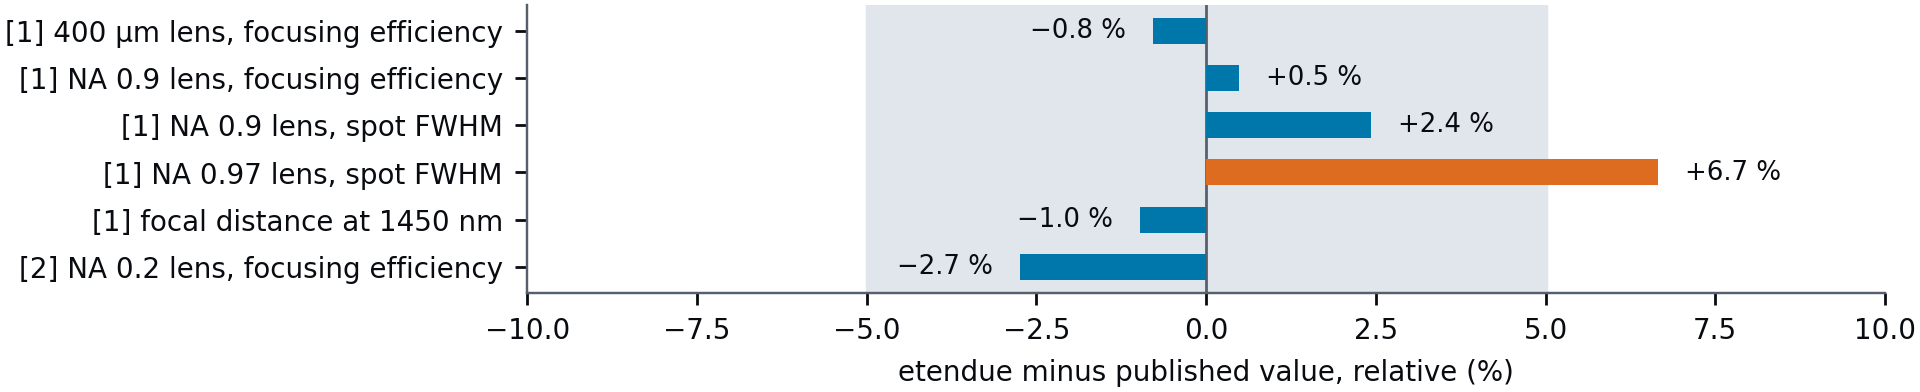
Figure 1. Relative deviation of etendue from each published single value; shaded band: ±5 %. Conditions: Table 1.
Summary of the comparison For the 400 μm lens of [1], etendue computes a focusing efficiency of 91.3 %. The authors measured more than 82 % and attribute about 10 % of losses to the fabricated device. For the silicon-nitride lens of [2], etendue gives 87.7 % of the ideal lens, against 90.2 % simulated and 89 % measured. The focal distance at 1450 nm agrees within 1.9 μm. At a numerical aperture of 0.9, the efficiency computed by etendue differs from the full-wave simulation of [1] by 0.4 points.
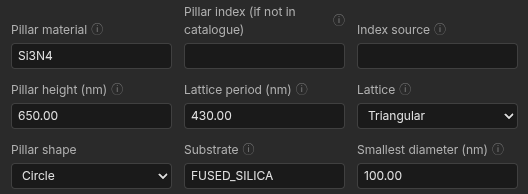
Figure 2. The metasurface entered in etendue for the lens of [2]: silicon-nitride pillars of 650 nm on fused silica, triangular lattice of 430 nm, diameters from 100 to 310 nm.
Conclusions For two independent published metalenses, at two wavelengths and with two pillar materials, etendue reproduces the simulated focusing efficiency within 3 points from a numerical aperture of 0.2 to 0.9, the spot size within 3 % at a numerical aperture of 0.9, and the focal shift with wavelength within 1 %.
etendue.io [1] a-Si, 1550 nm · [2] SiN, 550 nm · RCWA + angular spectrum · etendue, November 2026
Table 1. Published values and values computed by etendue
LENS AND QUANTITY PUBLISHED ETENDUE
[1] pillar library, 200–550 nm: lowest transmission outside the resonance, phase range > 92 %, 2π 92.5 %, 6.6 rad
[1] 400 μm lens, focus at 500 μm: focusing efficiency > 82 % measured, ≈ 10 % 91.3 % below simulation
| [1] 100 μm lens, focus at 25 μm: efficiency, spot FWHM | 72 %, 0.68 λ (FDTD) | 72.4 %, 0.696 λ |
| [1] 100 μm lens, focus at 12.5 μm: efficiency, spot FWHM | > 50 %, 0.51 λ (FDTD) | 55.0 %, 0.544 λ |
| [1] focal distance, 1550 → 1450 nm | ≈ 175 → ≈ 195 μm | 175.2 → 193.1 μm |
| [1] efficiency change at ±50 nm from 1550 nm | ≈ −5 % | −3.1 and −4.8 points |
| [2] NA 0.2 lens: efficiency relative to an ideal lens | 90.2 % simulated, 89 % | 87.7 % (transmission |
measured 97.3 %)
Efficiencies of [1] are the power within a disc of three times the spot FWHM divided by the incident power; those of [2] are the focused power relative to an ideal lens.
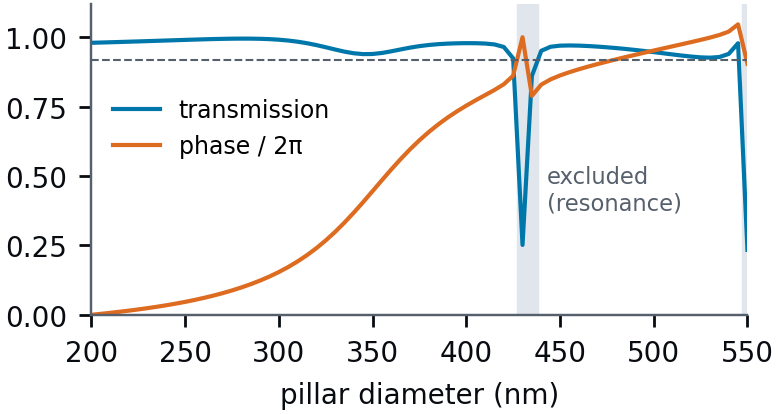
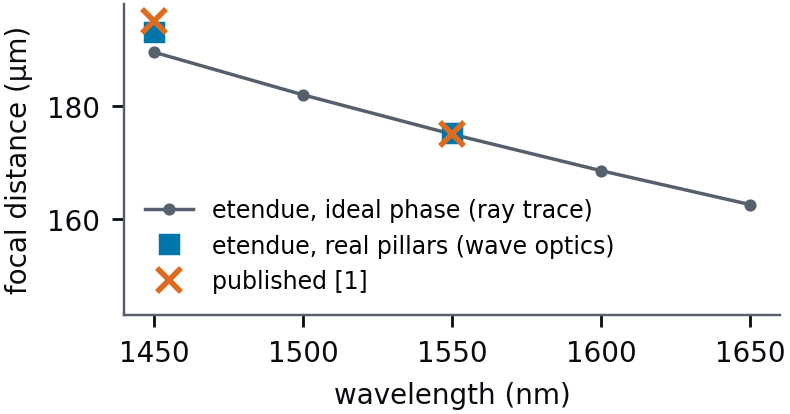
Figure 4. Focal distance of the d = 175 μm lens of [1] versus Figure 3. Pillar library of [1] computed by etendue: transmission and wavelength. Grey: ideal phase, traced; blue: real pillars and fibre phase of amorphous-silicon posts (940 nm, hexagonal lattice of illumination, wave optics; orange: values read in [1]. 800 nm, 1550 nm). Dashed line: 92 % stated by [1]; shaded: diameters at resonance, excluded as in [1].
Table 2. Internal checks
INTERNAL CHECK REFERENCE LARGEST DEVIATION
Homogeneous layer, 36 cases Exact thin-film formula 5.6 × 10⁻¹⁴
Pillar arrays, same truncation Independent RCWA code [3] 1.5 × 10⁻⁴ in T, 5 mrad
Ideal lens, energy within 3 × FWHM Airy pattern 1.4 × 10⁻⁴
Ideal lens, 10 μm square pixels: own pixel, neighbour Integral of the Airy pattern 7 × 10⁻⁴, 1.8 × 10⁻⁵
Limitations
Each pillar is computed in an array of identical pillars (local phase approximation). For very fast lenses, the transmission computed by etendue cannot be compared with the published one. etendue gives the zero-order transmission of each pillar in a locally periodic array, 97 % for the lens with a numerical aperture of 0.9. The full-wave simulation of [1] gives 85 % for the same lens, and the measurements of [1] count the power collected through a microscope objective with a numerical aperture of 0.95. The lens of [2] is 6 mm wide; it is modelled 200 μm wide at the same numerical aperture, with circular instead of hexagonal posts. Pillars with anisotropic shapes (geometric phase) and arrays of off-axis metalenses are not modelled.
References. [1] A. Arbabi, Y. Horie, A. J. Ball, M. Bagheri, A. Faraon, Nat. Commun. 6, 7069 (2015). [2] A. McClung, M. Torfeh, V. J. Einck, J. J. Watkins, A. Arbabi, arXiv:2312.13851. [3] W. Jin, W. Li, M. Orenstein, S. Fan, ACS Photonics 7, 2350 (2020). [4] T. Schuster et al., J. Opt. Soc. Am. A 24, 2880 (2007).