
Micro-optics · Imaging
Designing a microlens array imager: per-lenslet image quality, crosstalk and manufacturing data
3 × 3 lens array, 1 mm pitch, re-imaged onto a detector by a 1:1 relay at 550 nm
Designing a microlens array imager: per-lenslet image
quality, crosstalk and manufacturing data
3 × 3 lens array, 1 mm pitch, re-imaged onto a detector by a 1:1 relay at 550 nm
| The design problem | How the system is modelled |
| A microlens array splits one aperture into many small | The array is entered as one surface, defined by its pitch, |
| ones, and each lenslet forms its own image. This | the number of lenslets and the radius of a single lenslet. |
| principle is used in compound-eye cameras, light-field | Each analysis can then be restricted to one lenslet. The |
| cameras and Shack–Hartmann wavefront sensors. A | spot, the point spread function and the MTF are |
| designer has to check that each small image is sharp, | computed on that lenslet's own image and referred to the |
| that each lenslet keeps its light on its own part of the | centroid of that image. The image on the detector is |
| detector, and that the array can be specified to a | simulated by tracing rays from every pixel of a test chart |
| manufacturer. Conventional lens design analysis does | through the whole system. |
not report these quantities per lenslet. It treats the array as one aperture, and so mixes the nine images into a single spot or MTF.
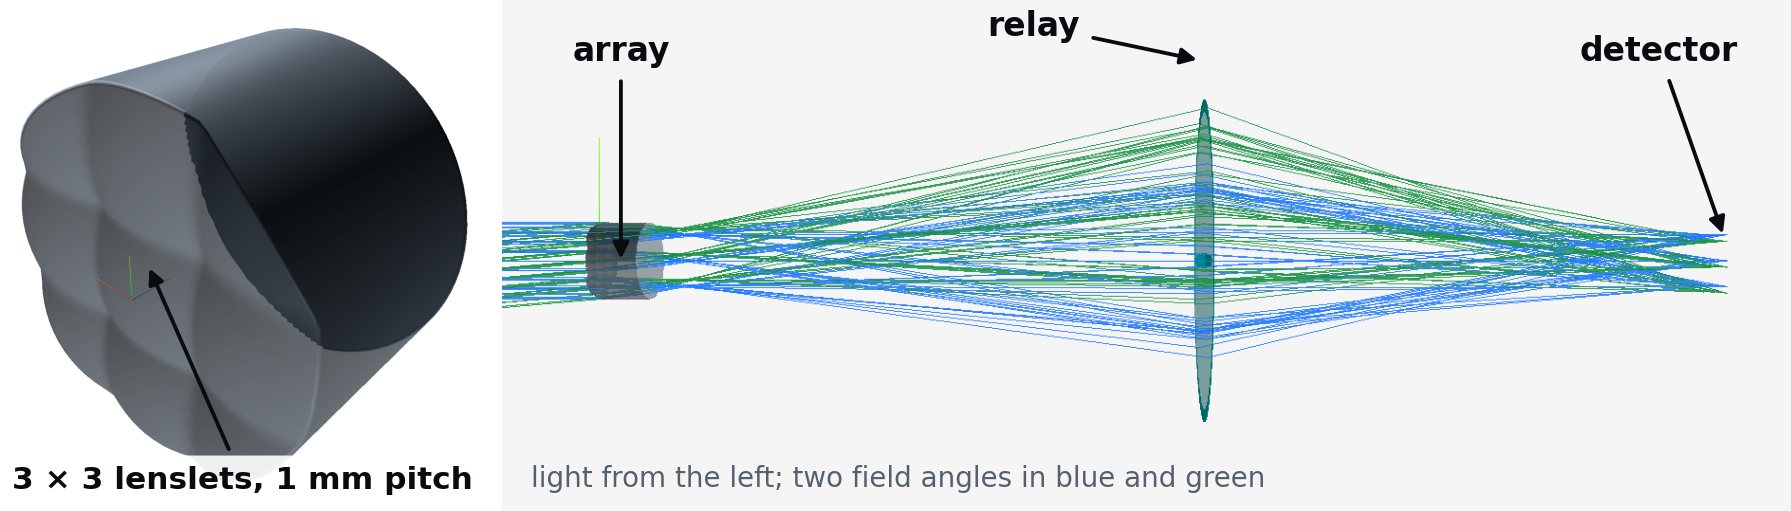
Figure 1. The model in etendue. Left, the plate seen in 3D: its front face carries the 3 × 3 lenslet domes. Right, a section with the traced ray bundles. The relay is an ideal lens, so that every aberration seen on the detector comes from the array.
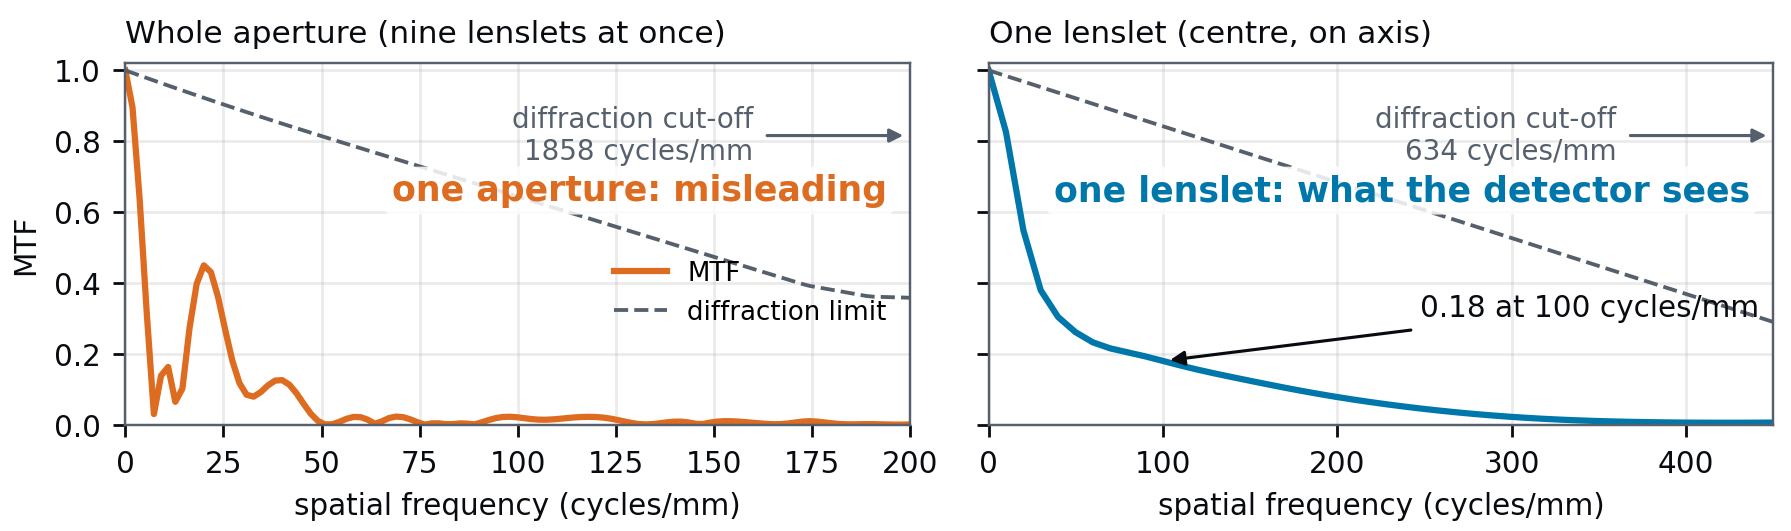
What the analysis shows on the starting design Seen as one aperture, 3 mm wide at f/1.0, the system appears to resolve up to 1860 cycles/mm. Each lenslet has a focal length of 2.9 mm and a 1 mm aperture, so it works at f/2.9 and its own diffraction cut-off is 634 cycles/mm. Spherical aberration lowers the resolution further. It gives a central lenslet an RMS spot radius of 13 μm, about seven times its Airy radius, and its MTF falls to 0.18 at 100 cycles/mm.
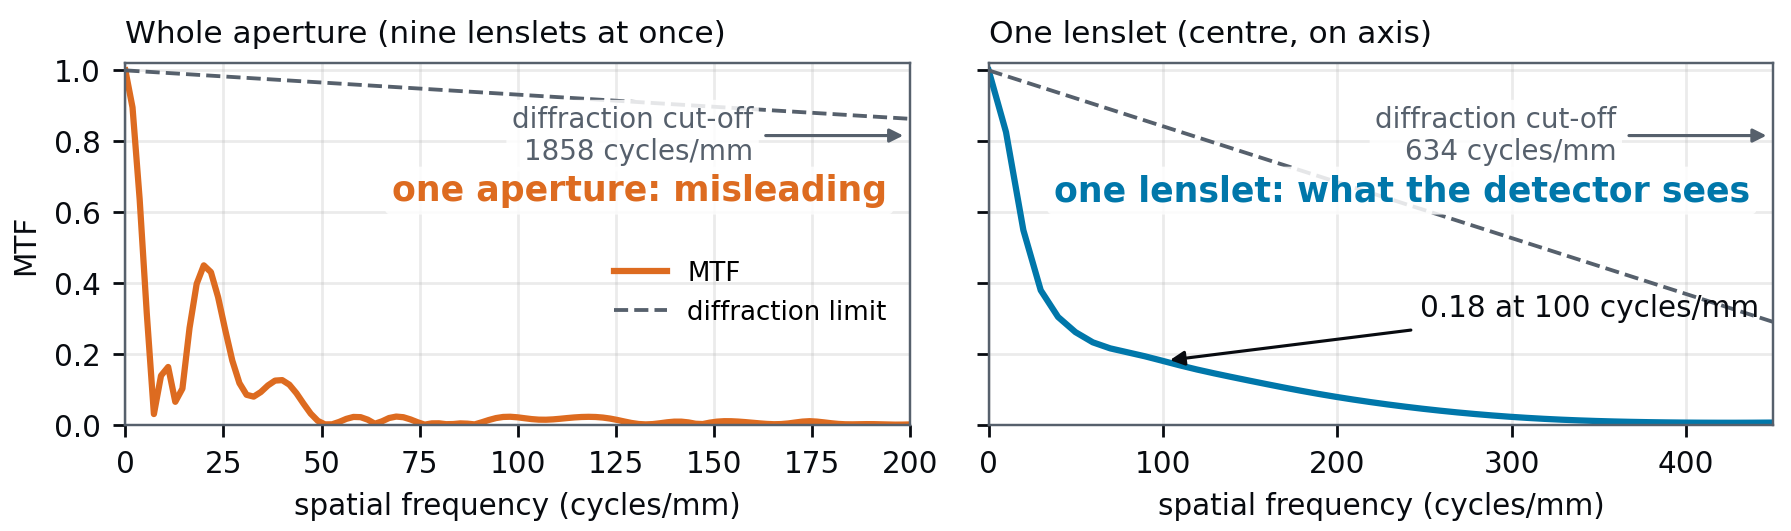
Figure 2. MTF on axis, traced from etendue data; each axis ends where the curve fades, the cut-offs lie beyond (arrows). Left, the whole aperture analysed as one lens, as a conventional analysis sees it, against the diffraction limit of a perfect 3 mm aperture at f/1.0 (dashed). Right, the centre lenslet against its own diffraction limit, that of a square aperture (dashed).
etendue.io 3 × 3 lenslets, 1 mm pitch, f/2.9 · 1:1 relay · 550 nm · etendue, October 2026
Crosstalk and field of view Up to 5° of field, each lenslet keeps all its light on its own part of the detector, counted ray by ray. At 10°, 61 % of the light from the central lenslet lands on a neighbour. The circular 3 mm aperture stop fits inside the square array, so it cuts off the outer corners of the corner lenslets. They work at f/4.8 instead of f/2.9. The crosstalk limits the usable field.
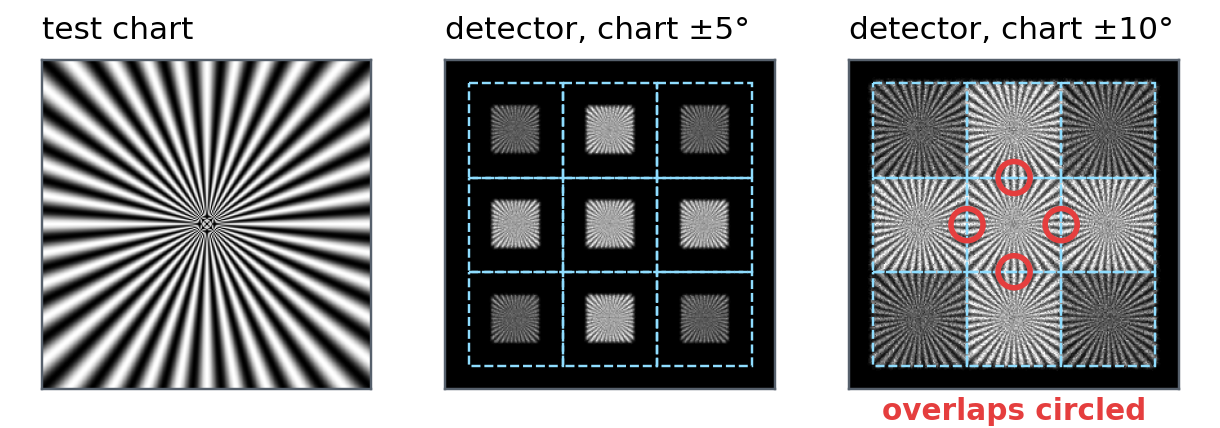
Figure 3. Image of a test chart simulated by etendue, ray by ray. Dashed squares mark the part of the detector behind each lenslet; the relay inverts the nine images. With the chart within ±5° the images stay apart. Within ±10° neighbouring images run into each other.
From the model to the manufacturer
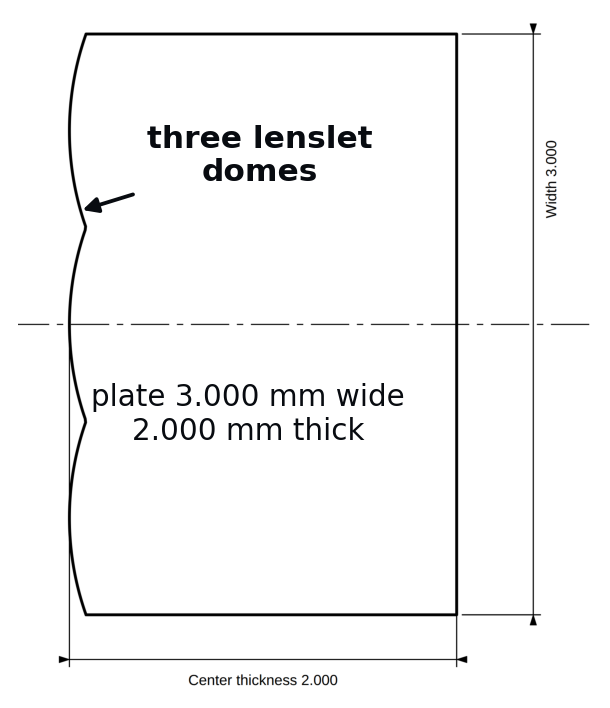
The lenslet surface is exported as a sag table that a diamond-turning or moulding supplier can read, together with a lens-design archive and a STEP plate for the mechanical design. An ISO 10110 drawing gives the plate section and its tolerance table.
Reliability of the results
Each analysis was compared with an exact formula or a published result before use. The focal lengths agree with the thick-lens formula. The image size and pitch agree with a published compound-eye imager [1]. The lenslet MTF agrees with the theoretical transfer function of a square pupil [2]. The sag table and the lens-
design archive read back to within 10^(-)^(1)^(4) mm of the traced surface, identical to ^(F)^(i)^(g)^(u)^(r)^(e)^(4)^(.)^(T)^(h)^(e)^(I)^(S)^(O)^(1)^(0)^(1)^(1)^(0)^(d)^(r)^(a)^(w)^(i)^(n)^(g) numerical precision, and the STEP plate to within 0.01 μm. exported by etendue, cropped on the section through one row of lenslets. CHECK REFERENCE LARGEST DEVIATION
Focus of each of the 9 lenslets Thick-lens formula 0.0003 μm
Image size and pitch Imager of [1] 0.76 % and 0.004 %
MTF of an aberration-free square lenslet Square pupil [2] 0.0017 in MTF
Sag table and lens-design archive, read back Traced surface 2.8 × 10⁻¹⁵ mm
STEP plate, 1000 random points Traced surface 0.0072 μm
Limitations The STEP plate covers rectangular lenslets that fill the plate. A hexagonal layout is exported as a .DAT sag table, without a CSV table or a STEP plate.
Use in teaching The case forms a design exercise in four stages: building the array and its relay, judging each image, finding the field and stop limits, and preparing the manufacturing data. Each stage uses the result of the previous one; no installation is needed.
References. [1] J. Tanida et al., Appl. Opt. 40(11), 1806–1813 (2001). [2] J. W. Goodman, Introduction to Fourier Optics, ch. 6. [3] ISO 10110.
etendue.io Per-lenslet spot, MTF and crosstalk · sequential ray tracing · etendue